Column Chart:
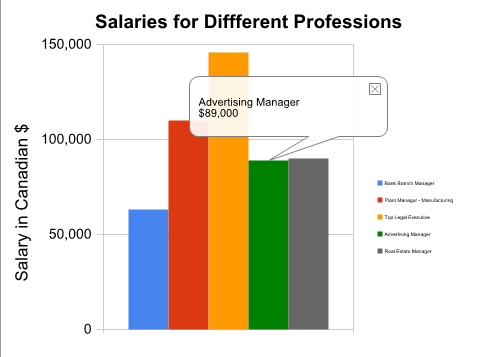
The following table lists the salaries of a few professions.
| Title | Salary of different professions |
|---|---|
| Bank Branch Manager | $63,000 |
| Plant Manager – Manufacturing | $110,000 |
| Top Legal Executive | $146,000 |
| Advertising Manager | $89,000 |
| Real Estate Manager | $90,000 |
A column chart shown below is a good way of comparing the compensation of these professions.
If you have difficulty reading the legend on the side as to which profession pays how much, you can always click on the particular column and Google Spreadsheets shows a popup giving the details of this column.
Bar Chart:
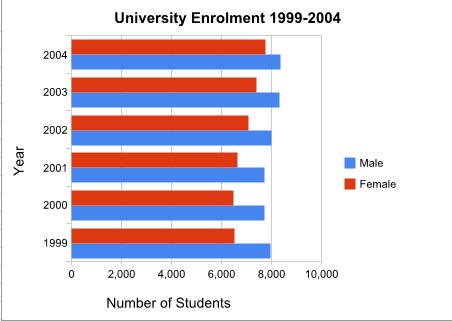
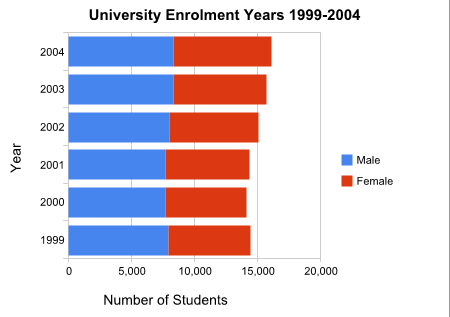
The following table lists the enrolment of students at an university during the years 1999 – 2004.
| Year | Male | Female |
|---|---|---|
| 1999 | 7965 | 6511 |
| 2000 | 7722 | 6462 |
| 2001 | 7722 | 6649 |
| 2002 | 8012 | 7063 |
| 2003 | 8308 | 7396 |
| 2004 | 8353 | 7747 |
This can be represented in a bar chart as shown below:
Or the same information can be represented as a stacked bar chart as shown below:
Line Chart:
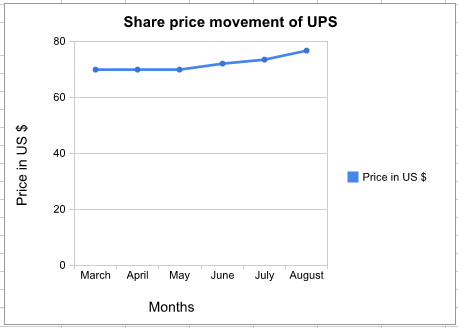
The following table lists the approximate share price of United Parcel Services in the past six months Mar 07 – Aug 07
| Month | Price in US $ |
|---|---|
| March 07 | 70 |
| April 07 | 70 |
| May 07 | 70 |
| June 07 | 72.25 |
| July 07 | 73.4 |
| August 07 | 76.9 |
As the shareprice changes with the movement of time, the following line chart is appropriate to show this information:
Pie Chart:
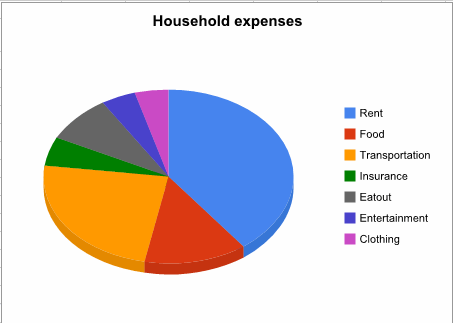
The following table gives the spread of monthly income (a total $ 2260) on various necessities of a family:
| Expense Item | Expenditure in $ |
|---|---|
| Rent | 900 |
| Food | 300 |
| Transportation | 540 |
| Insurance | 120 |
| Eatout | 200 |
| Entertainment | 100 |
| Clothing | 100 |
Since expense item is a segment of the whole (total monthly income), a 3D pie chart would be appropriate to represent this information:
Scatter Diagram:
The following table lists the Intelligent Quotient (IQ) of a group of students and the Grade Point Average (GPA) achieved by them.
| IQ | GPA $ |
|---|---|
| 102 | 2.8 |
| 108 | 3.2 |
| 110 | 3.3 |
| 112 | 3.5 |
| 120 | 4 |
| 125 | 4.5 |
If we intend to see any relationship exists between the two variables IQ and GPA, a scatter diagram is appropriate which is as shown below:
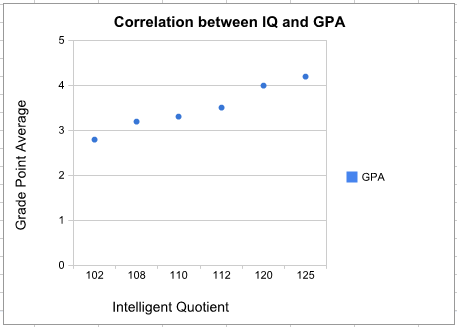
As we can see from the chart there seems to be a close correlation between Intelligent Quotient and Grade Point Average achieved by a student.
<--BackTo: Types of Charts - Choose the chart to suit the purpose
Next: Google Spreadsheets’ charting capability–>